Economic Operations Map
Explore the documented flow of U.S. money and resources through time. Where resources move. Where they accumulate. Who controls the pathways.
Concept preview. The live map and economic feeds are planned. The illustration below contains sample routes and change markers; it is not an operational map.
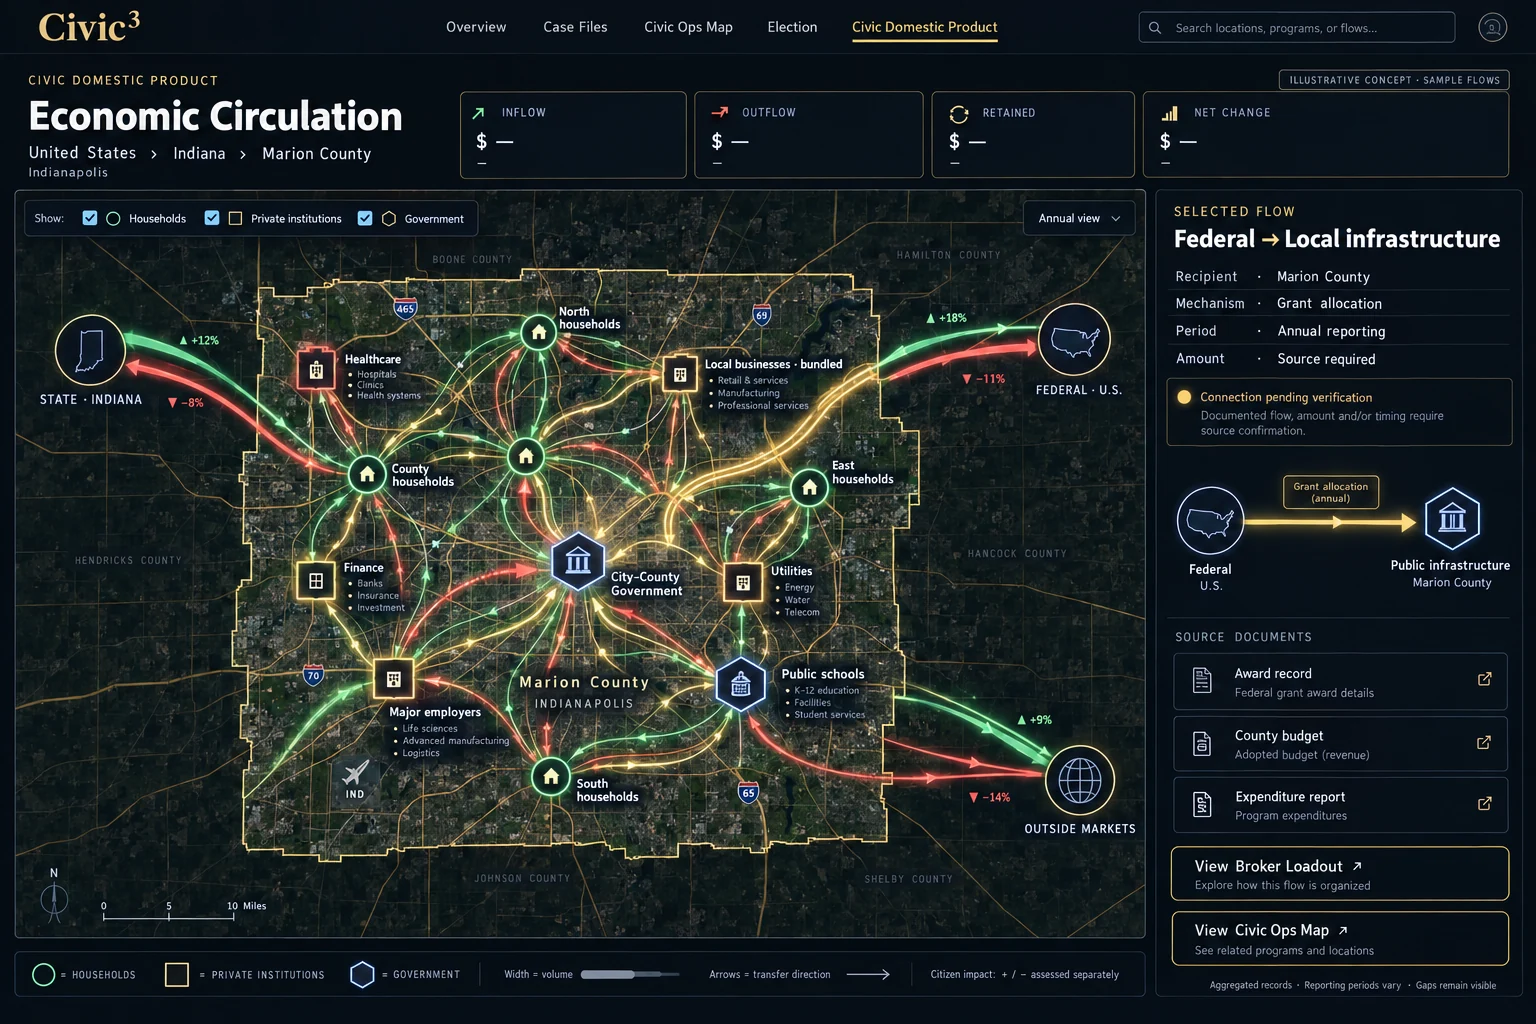
Households
County totals first. Optional demographic views where published data supports them. Individual residences are not required.
Private institutions
Major employers, businesses, banks, utilities, and nonprofits. Smaller entities grouped by sector, with coverage made explicit.
Government
Local, state, and federal collection, allocation, and spending. Cross-boundary routes show documented inflows and outflows.
The planned view
Follow a flow
Select a route to inspect its payer, recipient, mechanism, amount, reporting period, authority, and source documents. Width represents volume; arrows represent transfer direction. Citizen benefit or burden is assessed separately. Unknown destinations remain visible gaps.
Move through time
Compare documented expansion, contraction, and stasis. Distinguish the reporting period, event date, publication date, and ingestion date. Historical views preserve revisions and show which information was available then. Daily ingestion does not imply daily measurement.
Connect the separate maps
The Civic Operations Map examines constitutional conduct. Broker Loadouts explain authority and jurisdiction. This map examines economic circulation. Future links will carry a selected place, institution, or flow between these distinct views.
From illustration to living loadout
Begin with the original Equation image on CDP. Add accessible information panels, then dated and sourced statistics. Character animation is a later, optional layer. Institutional Quant can supply shared facts; proposed connections and interpretations require review.
Evidence and interpretation
Observed, estimated, and modeled flows must be distinguished. Aggregate records do not establish that the same dollars were tracked through every stage. Overlapping totals must not be summed twice. Each future assessment should expose its sources, method, reviewer, and correction pathway.